
SMART MONEY CONCEPTS | TRADERFACTOR EDUCATION
Displacement in Forex Trading: How to Identify Strong Market Moves Using Smart Money Concepts
Bullish Displacement • Bearish Displacement • Market Structure Shift • Break of Structure • Fair Value Gaps • Order Blocks • Liquidity
By Zahari Rangelov | TraderFactor Education
Have you ever watched EUR/USD, Gold or NAS100 suddenly move with a series of powerful candles, leaving little opportunity to enter before price travels a considerable distance?
Perhaps the market had been moving sideways for several hours. Then, within minutes, a strong candle broke through a previous high or low. The move appeared aggressive, and several traders rushed to follow it.
Sometimes price continued in the same direction. Other times, the breakout failed and immediately reversed.
How can you distinguish a meaningful directional move from ordinary volatility?
One concept used in Smart Money Concepts (SMC) and Inner Circle Trader (ICT) analysis is displacement.
Displacement describes a strong, relatively rapid price movement that stands out from the surrounding candles. It can help traders recognise changes in momentum, evaluate market structure breaks and identify areas where price may later retrace.
However, displacement alone does not guarantee that a market will continue in the same direction.
In this comprehensive guide, we explain how to identify bullish and bearish displacement, how it connects with liquidity, order blocks and Fair Value Gaps, and how to build a structured trading plan using real-world market concepts and clearly labelled hypothetical examples.
❓ Question for traders
When a large bullish or bearish candle appears on your chart, how can you determine whether it represents meaningful displacement or simply a temporary price spike that may reverse?
💡 What Traders Should Know:
The answer involves much more than candle size.
Market structure, liquidity, candle closes, location, follow-through and risk management
all matter.
📌 Key Takeaways: Displacement in Forex Trading
Displacement is a rapid directional price move that is unusually strong relative to recent price action. It often contains large-bodied candles, relatively small opposing wicks and limited candle overlap.
Bullish displacement represents strong upward price movement, while bearish displacement represents strong downward movement. A meaningful displacement move may break a previous swing high or low.
Displacement can contribute to a Break of Structure (BOS) or Market Structure Shift (MSS). Strong displacement may also create a three-candle Fair Value Gap (FVG), although not every displacement produces one.
A liquidity sweep followed by displacement in the opposite direction is a common SMC reversal model. Displacement can also help traders evaluate the strength of an order block.
Higher-timeframe structure provides context, while lower timeframes can help refine entries.
⚠️ Important: Large candles alone are not enough. News spikes, poor liquidity and false breakouts can also produce aggressive movement. Entry confirmation, invalidation levels and predefined risk remain essential.
⚡ Quick Answer: What Is Displacement in Forex Trading?
Displacement is a strong and rapid price movement in one direction, characterised by unusually large candles or a sequence of directional candles compared with recent market activity.
In Smart Money Concepts, traders pay particular attention when displacement occurs after a liquidity sweep, breaks an important market structure level or leaves behind a Fair Value Gap.
For example, if EUR/USD trades sideways and then produces several strong bullish candles that close above a meaningful swing high, traders may interpret the move as bullish displacement.
Remember: Displacement describes observable price behaviour. It does not prove which institutions traded or guarantee that the move will continue.
📚 What You Will Learn
- What displacement means
- How to identify strong displacement
- Bullish displacement explained
- Bearish displacement explained
- Displacement versus ordinary momentum
- Displacement and liquidity sweeps
- Displacement, BOS, CHoCH and MSS
- Displacement and Fair Value Gaps
- Displacement and order blocks
- Multi-timeframe analysis
- Step-by-step trading strategy
- Gold, EUR/USD and NAS100 examples
- Displacement during economic news
- Risk management and position sizing
- Common mistakes and failed setups
- Trading checklist and FAQs
1. What Is Displacement in Forex Trading?
Displacement refers to a directional price movement that is noticeably stronger than the candles immediately preceding it.
Instead of moving slowly through overlapping candles, the market advances or declines rapidly, often with one or more large candlestick bodies.
SMC and ICT traders examine these movements because they may indicate a temporary imbalance between aggressive buying and selling interest.
📊 Example: EUR/USD Displacement
For example, imagine EUR/USD has spent two hours trading inside a narrow 15-pip range.
Suddenly, several bullish candles appear and push price 35 pips higher.
If the candles close strongly, break a significant swing high and maintain directional follow-through, the movement may qualify as bullish displacement under the trader’s defined criteria.
The opposite applies when prices fall aggressively.
What Causes Displacement?
A sharp directional movement may develop when aggressive buying or selling overwhelms available liquidity at nearby prices.
Possible contributors include changes in economic expectations, central-bank decisions, large market orders, triggered stop-loss orders, breakout orders, important news, thinner liquidity and reactions around significant technical levels.
In SMC education, displacement is often described as a possible sign of institutional participation.
That explanation should be treated as an interpretation rather than a verified fact. An ordinary candlestick chart cannot identify the owner or exact motivation of the orders responsible for a move.
The practical value of displacement is that traders can observe, measure and test it.
2. How to Identify Strong Displacement on a Forex Chart
Not every large candle is meaningful displacement. A better approach is to evaluate several features together.
1. Large Candle Bodies
The candle body is substantially larger than recent candle bodies on the same timeframe.
2. Strong Closing Price
Bullish candles close near their highs, while bearish candles close near their lows.
3. Limited Overlap
Successive candles move directionally rather than repeatedly retracing into each other.
4. Structural Importance
The move travels through a meaningful swing or escapes a well-defined range.
5. Follow-Through
Subsequent candles support the direction rather than immediately reversing.
6. Useful Location
The move develops near a relevant liquidity area, higher-timeframe zone or structural level.
Measure the Candle Relative to Recent Price Action
Displacement should be judged relative to current volatility, not through a fixed number of pips.
A 20-pip movement may be significant on one currency pair and timeframe but ordinary on another.
One possible measurement method is to compare a candle’s real body with the average body size of recent candles.
Example: Measuring Bullish Displacement
Suppose the previous 10 candles on a EUR/USD M15 chart have an average real body of 8 pips.
A new bullish candle forms with a 21-pip body and a total high-to-low range of 25 pips.
| Measurement | Value | Interpretation |
|---|---|---|
| Average previous candle body | 8 pips | Baseline |
| New candle body | 21 pips | Unusually large |
| Body size ratio | 2.63 times | Strong relative expansion |
| Total candle range | 25 pips | Includes wicks |
| Body as percentage of range | 84% | Strong directional close |
Under a sample trading rule requiring a candle body at least twice the recent average and a body-to-range ratio above 65%, this candle would satisfy the candle-strength conditions.
But it would still require analysis of market structure, the surrounding price action and any subsequent follow-through.
⚠️ Important Measurement Rule
There is no universally accepted candle-size threshold that guarantees displacement.
Ratios such as 1.5 times or 2 times the recent average, as well as ATR-based filters, are optional research rules. They should be tested on the instrument and timeframe you trade.
ATR measures total price range rather than candle-body size, so an ATR-based test and a body-size test are not identical.
3. Bullish Displacement in Forex Trading
Bullish displacement occurs when price advances rapidly with strong buying momentum relative to recent market activity.
The movement often contains large bullish bodies, smaller upper wicks and a clear move through an important price level.
Characteristics of Bullish Displacement
Bullish displacement commonly involves one or more unusually large bullish candles closing near the upper portions of their ranges. Price advances with limited downward overlap and may break an important previous high.
A bullish Fair Value Gap may form, while price may later retrace toward the gap or the origin of the move.
📈 Illustration: Bullish Displacement After a Liquidity Sweep
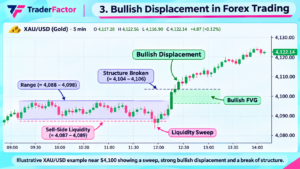
Figure 1: Simplified bullish displacement schematic. Price sweeps an earlier low, reverses strongly, breaks structure and leaves a potential bullish FVG. Educational illustration only; not a live or historical chart.
How to Read the Bullish Chart
- Identify sell-side liquidity: Previous lows provide a visible reference where stops and breakout orders may be concentrated.
- Observe the sweep: Price briefly moves below the previous low.
- Wait for bullish displacement: A strong upward move follows, with larger candle bodies and reduced overlap.
- Confirm structure: Price closes above the relevant lower-timeframe swing high.
- Mark the FVG: The impulsive move leaves a potential imbalance between the first and third candles of a three-candle sequence.
- Evaluate the retracement: A return toward the FVG or bullish order block can become an area to monitor for confirmation.
This is a common SMC reversal framework. However, the sweep is not enough by itself, and price may continue higher without revisiting the FVG.
4. Bearish Displacement in Forex Trading
Bearish displacement describes a strong and rapid downward movement that stands out from surrounding price action.
It frequently appears as one large bearish candle or several bearish candles moving lower with limited upward retracement.
Characteristics of Bearish Displacement
Bearish displacement commonly includes unusually large bearish candle bodies closing near their lows, with limited upward overlap.
The move may break an important swing low and leave a bearish Fair Value Gap. Price may later retrace toward a bearish FVG or order block.
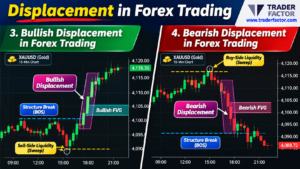
Figure 2: Simplified bearish displacement schematic. After a sweep above a previous high, aggressive selling breaks a lower structural level and leaves a potential bearish FVG. Not a live trading chart.
How to Read the Bearish Chart
- Price approaches a previous high containing potential buy-side liquidity.
- It briefly moves above the high before losing momentum.
- Strong bearish candles begin pushing prices lower.
- The move closes below a meaningful swing low.
- A bearish Fair Value Gap forms during the decline.
- Traders monitor a possible retracement toward the FVG or bearish order block.
The same logic can apply to EUR/USD, GBP/USD, Gold, Bitcoin and stock indices, but volatility, spreads and trading conditions differ substantially between instruments.
5. Displacement vs Ordinary Momentum: What’s the Difference?
Momentum describes the speed or strength of price movement. Displacement is a more specific SMC description of unusually forceful directional movement relative to the surrounding candles.
Although the concepts overlap, not every momentum move meets a trader’s displacement criteria.
| Feature | Ordinary Momentum | Strong Displacement |
|---|---|---|
| Candle size | May increase gradually | Clearly larger than recent candles |
| Directional movement | Can develop slowly | Rapid and forceful |
| Candle overlap | May remain considerable | Often limited |
| Structural break | Not required | Adds significance when present |
| Fair Value Gap | May or may not appear | Often associated with strong movement |
| Liquidity context | May be unclear | Evaluated around sweeps or breakouts |
| Trading interpretation | General price strength | Potential expansion or directional change |
Displacement vs a Large News Candle
Suppose US inflation data are released and Gold jumps $25 within seconds.
That movement is certainly fast and may qualify as displacement based on candle size.
But this does not mean the direction will persist.
Spreads may widen, prices may slip, liquidity may temporarily thin and the first move may reverse.
Traders should distinguish the observation of displacement from confirmation of a valid trading setup.
For additional context on genuine versus false breaks, explore TraderFactor’s Forex Breakout Strategy Guide.
6. Displacement and Liquidity Sweeps in SMC
One of the most commonly taught SMC sequences combines a liquidity sweep with displacement in the opposite direction.
Liquidity refers to the availability of orders that allow market transactions to take place. In chart-based SMC analysis, traders pay particular attention to obvious areas where stop orders may be concentrated.
Where Is Liquidity Commonly Found?
Liquidity is often discussed around previous swing highs and lows, equal highs, equal lows, previous daily highs and lows, major session extremes and widely followed support and resistance levels.
These are inferred order clusters; retail candlestick charts do not reveal the complete global order book.
🟢 Bullish Liquidity Sweep and Displacement
In this model, price briefly moves below an obvious low, then reverses upward with strong bullish candles.
If the movement breaks a significant lower-timeframe high, traders may interpret it as evidence that the immediate bearish structure is weakening.
🔴 Bearish Liquidity Sweep and Displacement
Here, price briefly moves above a visible high before selling pressure forces it lower through an important swing low.
For a detailed explanation, see TraderFactor’s Liquidity Sweep in Forex Guide and Buy-Side vs Sell-Side Liquidity Explained.
Can Displacement Occur Without a Liquidity Sweep?
Yes. A strong continuation move can occur without a clear sweep immediately beforehand.
For example, in a strong uptrend, price may consolidate above an earlier breakout level and then produce bullish displacement toward a new high.
In that case, displacement may support a trend-continuation interpretation rather than a reversal.
7. Displacement, BOS, CHoCH and Market Structure Shift
Displacement becomes more informative when traders understand the structure it affects.
Market structure is built from meaningful swing highs and swing lows.
An uptrend commonly produces higher highs and higher lows. A downtrend commonly produces lower highs and lower lows.
Traders use BOS, CHoCH and MSS to classify different structural developments.
| Concept | Meaning | Typical Interpretation |
|---|---|---|
| Displacement | Unusually strong directional price movement | Directional expansion |
| Break of Structure (BOS) | Price closes beyond a meaningful swing in the established trend direction | Potential continuation |
| Change of Character (CHoCH) | Price breaks an important swing against the preceding structure | Early reversal warning |
| Market Structure Shift (MSS) | A meaningful change in short-term structure, often associated with displacement | Possible directional transition |
Example: Bullish BOS With Displacement
Imagine Gold is already making higher highs and higher lows.
After a pullback, price rallies aggressively and closes above the previous swing high.
Because the break occurs in the direction of the existing uptrend, traders may classify it as a bullish BOS accompanied by displacement.
Example: Bullish MSS With Displacement
Now imagine Gold has been making lower highs and lower lows.
Price sweeps a recent low, reverses sharply and closes above an important lower high.
Some ICT traders would classify this as a bullish market structure shift, especially if the movement is forceful and leaves an FVG.
The important difference is the prior market context.
💡 Remember This Distinction
Displacement tells you how forcefully price moved.
Market structure tells you what the move changed.
A powerful candle that does not break a relevant swing may still represent displacement, but it does not automatically confirm BOS or MSS.
Definitions of CHoCH and MSS vary between ICT and other SMC teaching systems. Use one consistent definition when backtesting.
Learn more in Swing Highs and Swing Lows: Understanding Forex Market Structure.
8. How Displacement Creates Fair Value Gaps
A Fair Value Gap, commonly abbreviated FVG, is a price interval identified through a three-candle formation.
It occurs when the wick ranges of the first and third candles do not overlap.
Large displacement candles often contribute to these formations because price moves rapidly through a range.
🟢 Bullish Fair Value Gap
For a traditional bullish three-candle FVG, Candle 1 forms before the main upward expansion, Candle 2 produces a strong bullish move, and Candle 3 has a low above Candle 1’s high.
The interval between Candle 1’s high and Candle 3’s low is marked as the bullish FVG.
🔴 Bearish Fair Value Gap
For a bearish FVG, Candle 2 produces a strong bearish move and Candle 3 has a high below Candle 1’s low. The non-overlapping interval becomes the bearish FVG.
Why Do Traders Monitor These Areas?
SMC traders often watch whether price retraces into the FVG before continuing in the direction of the displacement.
Possible reference points include the near edge of the FVG, its midpoint (sometimes called consequential encroachment), the far edge and nearby order blocks or structural levels.
But a Fair Value Gap is not a guaranteed reversal zone, and there is no rule requiring price to fill every gap.
Price may retest part of the gap, fill the entire gap, move straight through it or never return to it.
The strength of the original displacement, higher-timeframe structure and subsequent price behaviour all affect how useful an FVG may be.
For a complete explanation, read TraderFactor’s Forex Market Imbalance and Fair Value Gap Guide.
9. Displacement and Order Blocks: Why They Work Together
Order blocks are another important part of SMC chart analysis.
In common SMC terminology, an order block is often marked around the final opposing candle or small group of candles before a strong directional move.
Displacement helps traders evaluate whether price moved meaningfully away from the zone.
Bullish Order Block With Displacement
Imagine price forms a bearish candle near a higher-timeframe support area.
Immediately afterward, strong bullish candles appear and break an important swing high.
The final bearish candle may be marked as a candidate bullish order block.
Its relevance is strengthened by the observed displacement and structural break, not simply because it is a bearish candle.
Bearish Order Block With Displacement
Similarly, the final bullish candle before a sharp bearish move may become a candidate bearish order block.
Traders may monitor the zone if the decline produces meaningful displacement and a break of structure.
What Makes an Order Block Worth Monitoring?
A candidate order block becomes more relevant when it forms near a meaningful market level, strong displacement follows its formation, price breaks relevant structure and the zone aligns with higher-timeframe context.
Nearby FVG or liquidity confluence, a clear invalidation level and the number of previous tests may also influence the assessment.
A candle marked as an order block does not prove that an institutional order remains there.
For detailed chart examples, see Order Blocks in Forex Trading: How to Identify and Trade Bullish and Bearish Order Blocks.
10. Multi-Timeframe Displacement Analysis
A displacement move that appears significant on M5 may be relatively small compared with the overall H4 trend.
This is why traders should evaluate the movement within a broader timeframe structure.
| Timeframe | Main Purpose | Displacement Focus |
|---|---|---|
| Weekly / Daily | Major directional context | Significant structural expansion and major zones |
| H4 | Intermediate structure | Important BOS, MSS and directional movement |
| H1 | Setup development | Displacement away from key zones |
| M15 | Intraday confirmation | Liquidity sweeps and structural changes |
| M5 | Entry refinement | Smaller FVGs, displacement and retests |
| M1 | Optional precision | Short-term movement with greater noise and trading-cost sensitivity |
Example: Daily Bullish, M15 Displacement
Suppose EUR/USD is bullish on the Daily chart, with higher highs and higher lows.
On H4, price returns toward an established support zone.
On M15, price sweeps a short-term low and produces strong bullish displacement, closing above a lower-timeframe swing high.
Traders may then watch M5 for a controlled pullback into an FVG.
The sequence provides a connection between broader market direction and the potential entry location.
However, a lower-timeframe signal can still fail even when it aligns with the higher-timeframe trend.
When Do Displacement Moves Commonly Appear?
Strong directional moves often occur during periods of increased activity, including the London trading session, New York trading session, London–New York overlap and major economic announcements.
Central-bank decisions and important geopolitical developments may also trigger aggressive directional movement.
See our Forex Trading Sessions Guide for more information about Asian, London and New York trading patterns.
11. How to Trade Displacement: A Step-by-Step SMC Strategy
A displacement-based approach should begin with market context and finish with risk management.
The following is an illustrative rules-based process for studying reversal or continuation setups. It should be backtested before any live use.
Step 1: Determine the Higher-Timeframe Bias
Begin with H4 or H1 market structure. Determine whether the market is producing higher highs and higher lows, making lower highs and lower lows, or showing signs of a meaningful structural break.
Also establish whether price is approaching a higher-timeframe support, resistance or order block zone.
Do not assume that every bullish M5 candle is an opportunity to buy.
Step 2: Mark Relevant Liquidity
Identify previous swing highs and lows, equal highs, equal lows and major session levels.
These areas help you understand where price may encounter clusters of orders.
Step 3: Wait for Price to Interact With the Level
Observe whether price sweeps liquidity, rejects a zone or breaks out of a consolidation.
Do not enter simply because price touches an order block or crosses a previous high.
Step 4: Identify Displacement
Look for meaningful directional expansion. Evaluate candle size relative to recent activity, body-to-range ratio, closing strength, limited opposing overlap and whether price moves beyond meaningful structure.
Step 5: Confirm Market Structure
For a bullish reversal, look for a close above the relevant lower high.
For a bearish reversal, look for a close below the relevant higher low.
A continuation setup may instead involve a BOS in the prevailing trend direction.
Step 6: Mark the FVG or Order Block
Identify the potential retracement zone left by the displacement.
The FVG and order block may overlap, but they are not the same concept.
Step 7: Plan the Entry
Choose a predefined entry method, such as a retest of an FVG edge, retracement toward the FVG midpoint, return to an order block or lower-timeframe confirmation inside the selected zone.
A limit order may not be filled, while waiting for confirmation can lead to a less favourable entry price. Both approaches involve trade-offs.
Step 8: Set Invalidation and Stop-Loss
Define the price level that would undermine your trade idea.
For a bullish reversal, this may be below the sweep low. For a bearish reversal, it may be above the sweep high.
Account for the instrument’s spread, volatility and contract specifications.
Step 9: Set a Logical Target
Potential targets may include opposing liquidity, previous swing highs or lows, daily or session extremes and higher-timeframe zones.
Evaluate whether the distance to the target justifies the risk and trading costs.
Step 10: Manage and Review the Trade
Follow the plan rather than moving the stop farther away simply because price moves against the position.
Afterward, record the setup, screenshots, costs, outcome and any deviations from your rules.
12. Practical Displacement Examples: Gold, EUR/USD and NAS100
The following examples use hypothetical prices to teach the process. They are not historical trade records, live signals or recommendations to buy or sell.
🥇 Example 1: Bullish Displacement on Gold (XAU/USD)
ILLUSTRATIVE BULLISH SETUP
Assume the H1 chart shows a broader bullish trend, while the M15 chart is temporarily pulling back.
Gold forms repeated lows around $4,092.
Price then briefly drops to $4,087, moving below the visible lows before reversing upward.
Strong bullish candles follow and close above a lower-timeframe swing high around $4,104.
During the move, a bullish FVG forms between $4,100 and $4,106.
Hypothetical Trade Plan
| Element | Level |
|---|---|
| Liquidity area | $4,092 |
| Sweep low | $4,087 |
| Bullish structure break | $4,104 |
| Potential FVG | $4,100–$4,106 |
| Illustrative buy entry | $4,103 |
| Illustrative stop-loss | $4,085 |
| Illustrative target | $4,139 |
| Price risk | $18 per ounce |
| Potential price reward | $36 per ounce |
| Gross reward-to-risk | 2:1 |
The model depends on price returning to the FVG, confirming support and not invalidating the bullish structure.
A fall below the chosen invalidation level would undermine the setup.
Actual monetary risk depends on Gold contract size, position size, execution and broker specifications.
💱 Example 2: Bearish Displacement on EUR/USD
ILLUSTRATIVE BEARISH SETUP
Suppose EUR/USD is trading near a higher-timeframe resistance zone.
The market forms equal highs around 1.0898.
Price briefly breaks above them to 1.0906, but fails to sustain the breakout.
Strong bearish displacement follows, closing below a meaningful lower-timeframe swing low at 1.0875.
A bearish FVG forms between 1.0878 and 1.0884.
Hypothetical Trade Plan
| Element | Level |
|---|---|
| Buy-side liquidity | 1.0898 |
| Sweep high | 1.0906 |
| Bearish structure break | 1.0875 |
| Bearish FVG | 1.0878–1.0884 |
| Illustrative sell entry | 1.0880 |
| Illustrative stop-loss | 1.0910 |
| Illustrative target | 1.0805 |
| Risk distance | 30 pips |
| Potential reward | 75 pips |
| Gross reward-to-risk | 2.5:1 |
If price retraces into the bearish FVG and the chosen entry condition is satisfied, the trader has a predefined entry, invalidation point and target.
If price instead reclaims the swept high, the bearish idea loses credibility.
This example also illustrates why a stop-loss should be based on setup invalidation rather than an arbitrary number of pips.
📈 Example 3: NAS100 Trend Continuation
Consider a hypothetical NAS100 chart in which H4 structure is bullish.
After a strong rally, the index pulls back toward an earlier support zone and consolidates.
Buyers then return, producing several strong bullish candles that close above a recent consolidation high.
The move leaves a bullish FVG on M15.
Here, the displacement is not necessarily a reversal. It may instead represent continuation of the existing bullish structure.
What to Check
Traders should examine whether the H4 trend remains bullish, whether price has closed beyond the relevant consolidation high and whether displacement is materially stronger than recent candles.
They should also assess whether the new FVG offers a logical retest area, whether sufficient room exists before the next resistance or liquidity level, and whether upcoming CPI, NFP, Fed announcements or technology earnings could create abnormal volatility.
Index traders must also consider gaps between sessions, changing spreads and volatility around market opens.
13. Displacement During CPI, NFP and FOMC Announcements
Major economic announcements can create some of the largest intraday candles in forex, Gold and stock indices.
Important examples include the US Consumer Price Index (CPI), Nonfarm Payrolls (NFP), Federal Reserve interest-rate decisions, FOMC statements, Personal Consumption Expenditures (PCE), major central-bank announcements and unexpected geopolitical developments.
During these events, prices may move quickly because new information changes expectations and traders reposition their orders.
But a large news candle does not automatically create a reliable displacement trading setup.
Why Trading News Displacement Can Be Risky
Bid-ask spreads can widen significantly, orders may fill at worse prices than expected and the initial market reaction can reverse rapidly.
One-minute candles may exaggerate short-lived volatility. Price can move through an FVG without reacting, and stop-loss execution prices are not guaranteed during extreme volatility.
A Practical News-Day Approach
- Mark relevant price levels before the announcement.
- Review the economic forecast and previous result.
- Allow the initial volatility to develop.
- Observe whether price establishes a meaningful structural break.
- Wait for a controlled retracement if that is part of the model.
- Assess spread, volatility and available risk.
- Stand aside if conditions remain unstable.
⚠️ A Strong News Candle Is Not an Entry Signal by Itself
The fact that price travels a long distance quickly does not tell you whether the move is sustainable.
A trader who enters late may have a poor entry location, wide stop-loss requirement and unfavourable reward-to-risk ratio.
Waiting for confirmation may mean missing the move entirely. Missing a trade is preferable to taking one that does not meet your rules.
14. Risk Management: How Much Should You Risk on a Displacement Setup?
Displacement-based setups often look attractive because price has already shown strong movement.
However, the setup can still fail immediately after entry.
Risk management must therefore be established before the trade, not after price moves against you.
Step 1: Determine Your Maximum Risk
Choose an amount you can afford to lose without compromising your trading account or financial obligations.
For illustration, assume a trading account of $10,000 and planned risk of 0.5%.
The maximum planned loss before costs would be $50.
Step 2: Measure Your Stop-Loss Distance
Suppose your EUR/USD trade has a 25-pip stop-loss.
For a standard 100,000-unit EUR/USD lot in a USD-denominated account, the pip value is approximately $10 per pip.
Using the example:
Before trading costs, 0.20 standard lots with a 25-pip stop represents approximately $50 of planned price risk.
This calculation assumes conventional EUR/USD contract specifications and does not include commissions, spread effects or slippage.
Step 3: Check Reward-to-Risk
If you risk 25 pips to pursue a 50-pip target, the gross reward-to-risk ratio is 2:1.
However, a high reward-to-risk ratio alone does not mean a strategy is profitable.
Win rate, trading costs, execution quality and drawdowns all affect results.
Step 4: Record Your Results
Use a trading journal to track the instrument, timeframe, higher-timeframe bias, displacement body ratio, liquidity context, structural break, FVG formation, entry, stop-loss, target, spread, commissions, realised reward-to-risk and whether the setup followed your rules.
After a meaningful sample of trades, compare results by instrument, trading session and setup type.
15. Common Displacement Trading Mistakes
Mistake 1: Assuming Every Large Candle Is Institutional Displacement
A large candle proves that price moved strongly during that period. It does not prove that a bank entered or exited a specific position.
Mistake 2: Ignoring Higher-Timeframe Structure
A strong bullish M5 move may still be a minor retracement within a much larger H4 downtrend.
Mistake 3: Entering After the Move Is Already Extended
Chasing a displacement candle can lead to a poor reward-to-risk ratio and unnecessary exposure to a pullback.
Mistake 4: Treating Every FVG as Guaranteed Support or Resistance
Some FVGs receive a reaction, while others are crossed without meaningful hesitation.
Mistake 5: Labelling an MSS Without a Meaningful Structural Break
A strong candle does not automatically mean market structure has changed.
Identify the specific swing whose break would invalidate the preceding short-term direction.
Mistake 6: Using Arbitrary Stop-Loss Distances
Stops should reflect the trade’s invalidation logic and instrument characteristics, rather than being selected only to produce an attractive reward-to-risk figure.
Mistake 7: Overlooking News and Trading Costs
Strong movement around data releases can produce wider spreads, slippage and rapid reversals.
Mistake 8: Moving the Rules After Seeing the Result
Backtesting is unreliable when traders redraw swing points or redefine displacement after knowing whether a trade succeeded.
Key Lesson: Write the rules first and apply them consistently.
16. TraderFactor Displacement Trading Checklist
Use this checklist when evaluating a potential displacement setup.
📌 Before the Move
- ☐ Identify the Daily, H4 or H1 market direction.
- ☐ Mark significant swing highs and lows.
- ☐ Identify relevant liquidity zones.
- ☐ Locate nearby higher-timeframe support, resistance or order blocks.
- ☐ Check the economic calendar.
📈 During Displacement
- ☐ Compare candle size with recent price action.
- ☐ Check body-to-range strength.
- ☐ Look for limited candle overlap.
- ☐ Identify the meaningful swing level being challenged.
- ☐ Determine whether the move is continuation or a possible reversal.
🎯 After Displacement
- ☐ Confirm the relevant candle close and structural break.
- ☐ Mark any valid FVG and candidate order block.
- ☐ Decide whether a retracement entry is appropriate.
- ☐ Define the exact invalidation level.
- ☐ Calculate position size before entry.
- ☐ Identify a logical target and acceptable reward-to-risk.
- ☐ Record the setup and outcome.
A Simple Displacement Quality Scorecard
The following scoring framework can help traders apply consistent research criteria. It is not a validated probability model.
| Condition | Points |
|---|---|
| Higher-timeframe direction supports the setup | 1 |
| Setup forms at a meaningful liquidity or structural area | 1 |
| Candle strength exceeds a predefined volatility threshold | 1 |
| Relevant market structure breaks on a closing basis | 1 |
| Follow-through supports the displacement direction | 1 |
| A clearly defined entry zone and invalidation exist | 1 |
| Reward-to-risk is acceptable after estimated costs | 1 |
A score of 7 simply means that all seven selected research conditions are present. It does not establish a 70%, 80% or any other probability of winning.
Test whether combinations of these factors improve outcomes over a representative sample, including losing trades.
17. Frequently Asked Questions About Displacement in Forex Trading
What is displacement in forex trading?
Displacement is an unusually strong and rapid directional price movement relative to recent trading activity. It commonly features large candle bodies, limited overlap and strong closing prices.
What is bullish displacement?
Bullish displacement is a strong upward price movement. It may accompany a bullish BOS, an MSS or a breakout from consolidation.
What is bearish displacement?
Bearish displacement is a rapid and forceful decline, commonly involving strong bearish candle closes and limited upward overlap.
What is the difference between displacement and BOS?
Displacement describes the force of movement, while BOS refers to price breaking a meaningful swing in the direction of the established trend.
Is displacement the same as a Market Structure Shift?
No. Displacement concerns the strength of a move. An MSS concerns a change in relevant market structure, often accompanied by displacement.
Does displacement always create a Fair Value Gap?
No. Strong movement often creates FVGs, but the required three-candle wick non-overlap may not form. A displacement move can still exist without a textbook FVG.
Does price always return to the displacement FVG?
No. Price may partially retrace, fill the gap, move through it or never revisit it.
Can displacement occur without a liquidity sweep?
Yes. Displacement can occur during trend continuation, breakouts and other directional expansions without a visible preceding sweep.
Which timeframe is best for displacement trading?
No single timeframe is best for everyone. H4 and H1 provide broader context, while M15 and M5 can help identify intraday displacement. Lower timeframes generally involve greater noise and trading-cost sensitivity.
Can displacement be used for Gold trading?
Yes. Traders can study displacement on XAU/USD charts alongside liquidity, market structure and FVGs. Gold’s volatility and contract specifications require appropriate risk controls.
Is a large news candle a displacement signal?
It may qualify as displacement based on its price characteristics, but it is not automatically a valid trading setup. Spreads, slippage and sudden reversals can make news trading particularly risky.
Can beginners learn displacement trading?
Yes. Beginners can study the concept through historical charts and demo trading. They should first understand candlesticks, market structure, position sizing and risk management.
18. Final Thoughts: Displacement Is About Context, Not Candle Size Alone
Displacement is one of the most useful concepts for connecting momentum, market structure, liquidity and price imbalance in Smart Money Concepts trading.
However, a large bullish or bearish candle should never be treated as proof that a trade will succeed.
Strong displacement becomes more informative when traders can answer several questions:
- Where did the move begin?
- What was the broader market direction?
- Did price interact with meaningful liquidity?
- Was an important swing broken?
- Did price maintain directional follow-through?
- Is there a sensible retracement zone?
- Where is the trade invalidated?
- Does the possible reward justify the risk?
🎯 The Core Lesson: Do not chase displacement merely because price is moving quickly. Understand where the move fits within market structure and wait for a setup that follows your predefined rules.
The combination of careful observation, consistent execution and disciplined risk management is more important than any individual SMC label.
📚 Continue Learning Smart Money Concepts
Displacement connects several important price-action concepts. Continue building your understanding with these TraderFactor educational guides.
💼 Compare Forex Brokers With TraderFactor
Want to explore brokers offering Forex, Gold, indices and other trading instruments?
TraderFactor helps you compare broker regulation, trading platforms, spreads, commissions, account types and available markets.
Choosing a suitable broker is an important part of building a trading plan, whether you use Smart Money Concepts, price action or another strategy.
About the Author

Zahari Rangelov
Head of International Business Development, TraderFactor
Zahari contributes to TraderFactor’s financial market education and industry coverage, helping readers understand trading concepts, market developments and broker services.
Reviewed by Alex Kanyi
Head of Compliance | TraderFactor
Published: November 2026
Educational Examples
The chart illustrations, model trade prices, reward-to-risk calculations and scenarios in this article are hypothetical. They are intended to demonstrate analytical methods, not actual historical returns or current trade recommendations.
Risk Disclaimer
This article is provided for general information and education only. It does not constitute investment advice, personalised financial guidance or a recommendation to enter any trade. Forex, CFDs, commodities, stock indices and leveraged trading involve significant risk.
Actual losses can exceed planned levels in certain conditions because of slippage, execution and product-specific risks. Always conduct independent research and evaluate your financial circumstances before trading.