
GBPUSD pair didn’t escape the day’s bearish grip, tumbling below the 1.2600 figure as the European session found its footing. Fresh stats from the UK are bringing the chill of January to the currency market with a reported 0.6% monthly dip in the Consumer Price Index (CPI), dealing a blow to the Pound Sterling’s stance.
GBPUSD Daily Chart
Despite a stagnant year-on-year CPI that holds at 4% and core inflation at a steady 5.1%, the GBP/USD pair touched new weekly lows, suggesting it’s not yet out of the woods and additional declines could be on the horizon.
The Consumer Prices Index along with owner occupiers’ housing costs (CPIH) experienced a 4.2% growth over the year until January 2024, mirroring the rate seen in December 2023.
On a month-to-month basis, a dip of 0.4% was recorded for CPIH in January 2024, identical to the rate from January 2023.
Similarly, the Consumer Prices Index (CPI) saw an increase of 4.0% over the 12 months leading up to January 2024, which was the same percentage as in December 2023.
When viewed monthly, CPI showed a decrease by 0.6% in January 2024, matching the rate from January 2023.
The most significant rise affecting both CPIH and CPI annual rates on a monthly basis was attributed to housing and household services, primarily due to increased gas and electricity charges. Conversely, the most notable decrease came from furniture, household goods, and food and non-alcoholic beverages.
Core CPIH, excluding factors such as energy, food, alcohol, and tobacco, went up by 5.1% over the 12 months to January 2024, a slight drop from 5.2% in December 2023. The annual rate for CPIH goods slowed from 1.9% to 1.8%, whereas the CPIH services annual rate saw an increase from 6.0% to 6.1%.
Likewise, Core CPI (excluding energy, food, alcohol, and tobacco) rose by 5.1% over the year to January 2024, maintaining the same rate as in December 2023. The annual rate for CPI goods decelerated from 1.9% to 1.8%, while the CPI services annual rate grew from 6.4% to…
Here’s a simplified table for a quick glance:
| Index | Yearly Rate (Jan 2024) | Monthly Rate (Jan 2024) | Largest Upward Contribution | Largest Downward Contribution |
|---|---|---|---|---|
| CPIH | 4.2% | -0.4% | Housing & Household Services | Furniture, Household Goods, Food & Non-Alcoholic Beverages |
| CPI | 4.0% | -0.6% | Housing & Household Services | Furniture, Household Goods, Food & Non-Alcoholic Beverages |
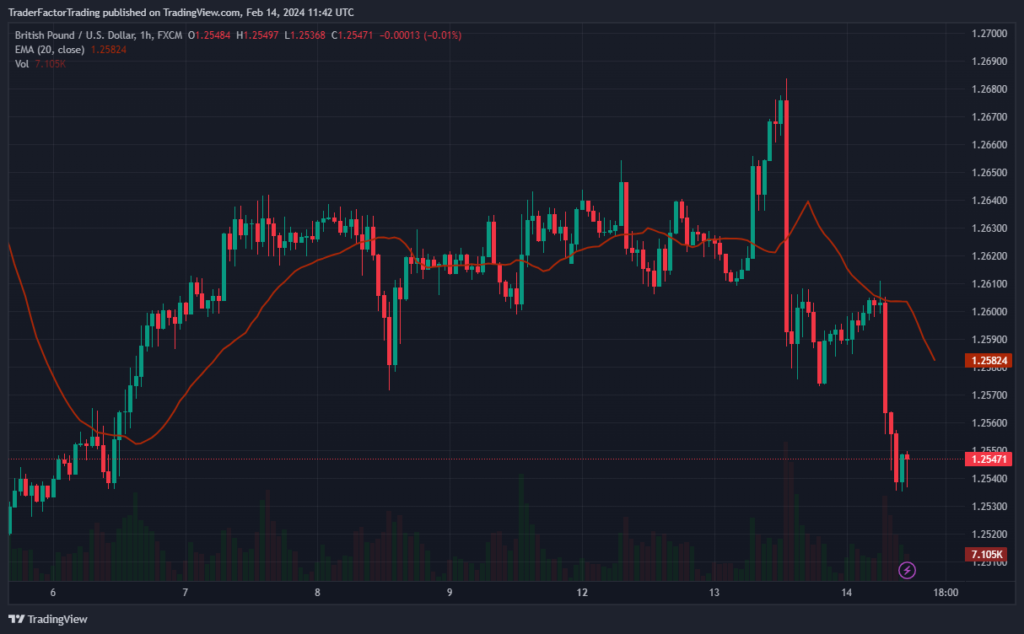
GBPUSD Intraday
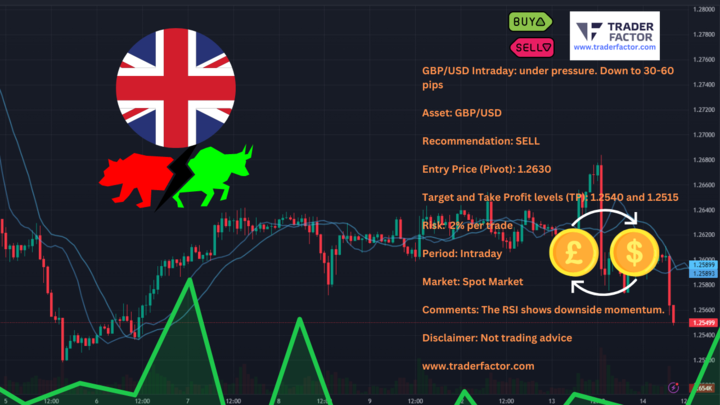
Looking ahead, the direction of the British Pound may hinge on the words of Bank of England Governor Andrew Bailey. His forthcoming testimony could either lend support to the currency if he takes stock of the firmly-rooted inflation or could further unsettle it if he sends dovish signals about the monetary policy path. For now, the technical analysis positions GBP/USD in a vulnerable spot, intensifying the call for a selling stance with target levels looking towards 1.2540 and 1.2515.
EURUSD Falters Amidst Euro Area’s Marginal Growth
As the European trading session unfolds on a Wednesday, the spotlight falls on the EUR/USD pair, which clings to the 1.0700 mark. The recent economic dispatches from the Euro area provided investors a mixed bag—there’s a murmur of growth in the area as GDP nudges upward merely by an annual rate of 0.1% in the final quarter of last year.
Compounding the intrigue, Industrial Production surpasses expectations with a 1.2% expansion year-on-year in December. Despite these sparks of positive data, the EUR/USD pair is showing signs of retreat.
The U.S. Bureau of Labor Statistics has reported a 0.3% rise in the Consumer Price Index for All Urban Consumers (CPI-U) in January, following a 0.2% increase in December, on a seasonally adjusted basis. The total index surged 3.1% over the past 12 months before seasonal adjustment.
The shelter index, contributing more than two-thirds to the overall monthly increase, rose by 0.6% in January. The food index also saw a rise of 0.4%, with both the indices for food at home and food away from home increasing by 0.4% and 0.5% respectively. Conversely, the energy index dropped by 0.9% mainly due to a fall in the gasoline index.
Excluding food and energy, the index for all items increased by 0.4% in January. Indices that saw a rise included shelter, motor vehicle insurance, and medical care, while those that decreased included used cars and trucks and apparel.
Over the 12 months ending in January, the all items index saw a 3.1% rise, which was less than the 3.4% increase over the 12 months ending in December. The index for all items less food and energy rose by 3.9% over the last 12 months, matching the increase for the 12 months ending in December. The energy index fell by 4.6% for the 12 months ending in January, whereas the food index rose by 2.6% over the past year.
Here’s a summary table
| Index | Monthly Change (Jan) | Yearly Change |
|---|---|---|
| CPI-U | +0.3% | +3.1% |
| Shelter | +0.6% | N/A |
| Food (Total) | +0.4% | +2.6% |
| Food at Home | +0.4% | N/A |
| Food Away from Home | +0.5% | N/A |
| Energy | -0.9% | -4.6% |
| All Items less Food and Energy | +0.4% | +3.9% |
EURUSD Daily Chart
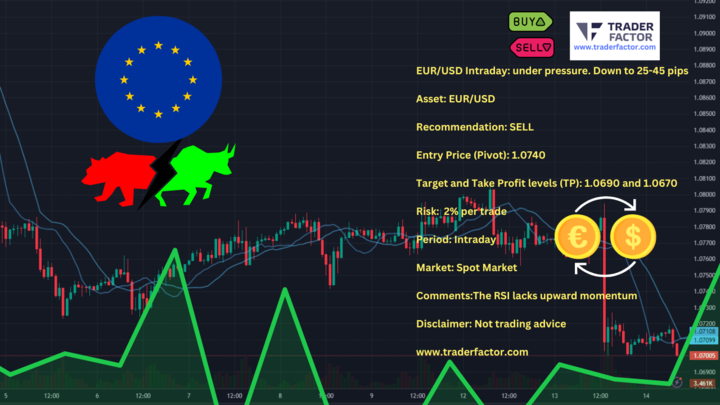
Traders are watching the Support-turned-Resistance level near 1.0740 as a pivot point for the unfolding price action. As it lingers under pressure, the spotlight shines on potential downtargets at the 1.0690 and 1.0670 thresholds. The sell recommendation arises amidst a backdrop where the Relative Strength Index (RSI) signals weakness ahead.
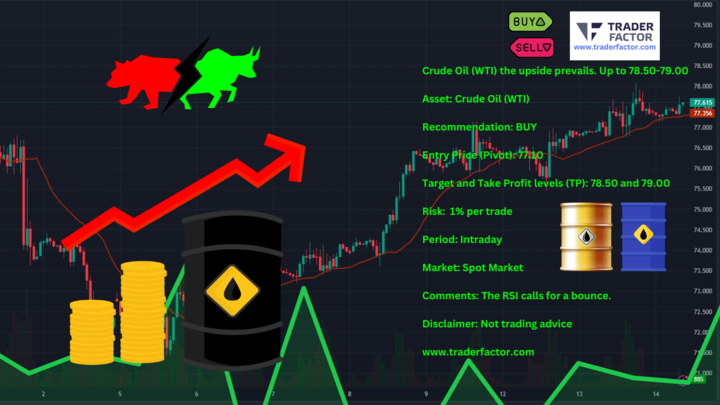
Crude Oil Aims Higher Amidst Market Optimism
The bouncy journey of Crude Oil (WTI) takes a positive turn, as the market forecasts an ascent to the realms of 78.50-79.00. Investors dipping their toes into the energy sector have their eyes peeled at the entry price orbiting around 77.10. Backed by a supportive RSI that whispers of a bounce, there’s a palpable optimism in the trading air for those betting on black gold to surge.
WTI Crude Oil Daily Chart
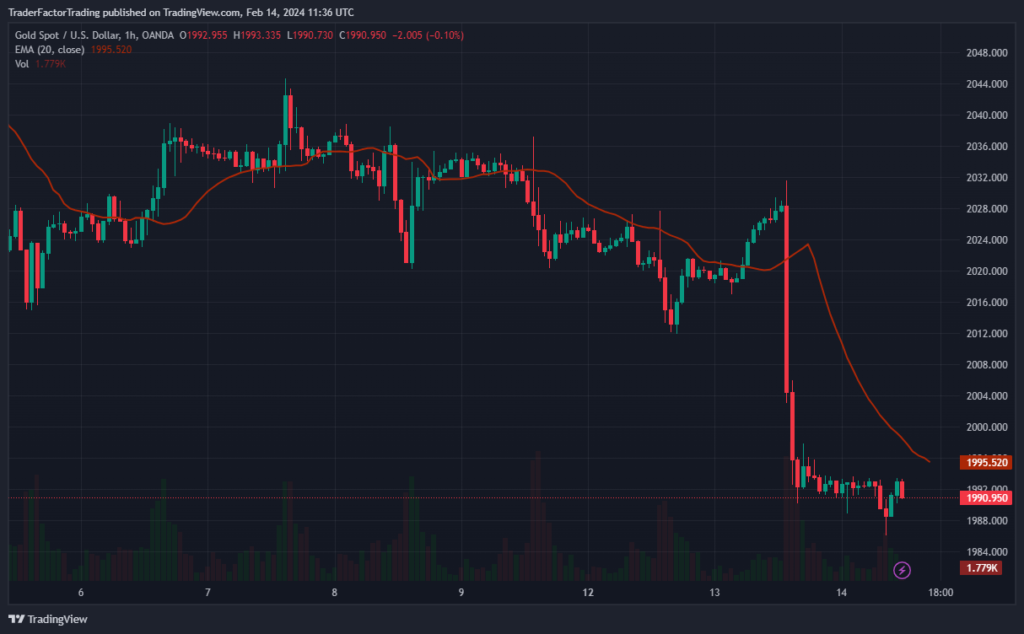
Sideways Dance Continues for Gold Amid US Inflation Data
Gold’s glimmer dims under the psychological weight of the $2,000 level as the consolidation game persists before the European traders take their desks. The tenacious tug from robust US inflation data play against the precious metal, keeping it tethered below a two-month threshold. While traders might speculate on when the Fed will introduce a rate cut, Treasury yields are keeping the bears in check for now, placing a wet blanket over gold’s luster.
XAUUSD Daily Chart
Unsteady Footing for Yen Post US Inflation Surprise
Over in Tokyo, reverberations of the US’s higher than anticipated inflation figures do more than ruffle feathers—they send ripples of concern through the market corridors regarding the Japanese Yen (JPY). Analysts at MUFG Bank are casting a speculative glance at the currency’s trajectory, pondering the effects of the USD’s domineering performance post-inflation announcement.
USD Reigns Superior Following Inflation Shockwave
The trading landscape witnessed the US Dollar flexing its muscles in the latter half of Tuesday, overshadowing its peers as EUR/USD experienced a tangible decline. The US inflation narrative unfolded, revealing a month-on-month dip to 3.1% in January, stubbornly exceeding forecasts. Likewise, core CPI stuck to its 3.9% peak, overshadowing expectations yet again.
This positive data recalibrated market bets, boosting the likelihood of the Fed maintaining a steady policy rate in near-term meetings—a sentiment that upholds the USD’s current stronghold. As the US Dollar Index (DXY) climbs to a 3-month high, traders are taking notice. With the greenback reigning supreme, USD/JPY may hit a 105.00 figure on its upward trajectory.
Disclaimer:
All information has been prepared by TraderFactor or partners. The information does not contain a record of TraderFactor or partner’s prices or an offer of or solicitation for a transaction in any financial instrument. No representation or warranty is given as to the accuracy or completeness of this information. Any material provided does not have regard to the specific investment objective and financial situation of any person who may read it. Past performance is not a reliable indicator of future performance.